

MS Excel: How to use the VARPA Function (WS)
This Excel tutorial explains how to use the Excel VARPA function with syntax and examples.
Description
The Microsoft Excel VARPA function returns the variance of a population based on an entire population of numbers, text, and logical values (ie: TRUE or FALSE).
The VARPA function is a built-in function in Excel that is categorized as a Statistical Function. It can be used as a worksheet function (WS) in Excel. As a worksheet function, the VARPA function can be entered as part of a formula in a cell of a worksheet.
Syntax
The syntax for the VARPA function in Microsoft Excel is:
VARPA( value1, [value2, ... value_n] )
Parameters or Arguments
- value1
- The first population value that can be a number, text, or a logical value. A value that is TRUE is evaluated as 1. A value that is FALSE or a text value is evaluated as 0.
- value2, ... value_n
- Optional. Additional population values that can be numbers, text, and logical values. There can be up to 30 values entered.
Returns
The VARPA function returns a numeric value.
Applies To
- Excel for Office 365, Excel 2019, Excel 2016, Excel 2013, Excel 2011 for Mac, Excel 2010, Excel 2007, Excel 2003, Excel XP, Excel 2000
Type of Function
- Worksheet function (WS)
Example (as Worksheet Function)
Let's look at some Excel VARPA function examples and explore how to use the VARPA function as a worksheet function in Microsoft Excel:
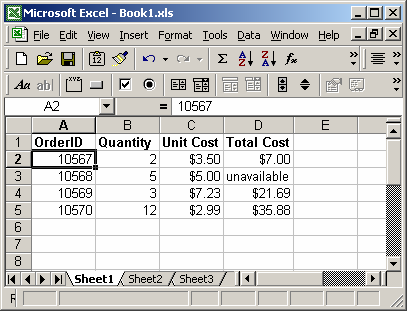
Based on the Excel spreadsheet above, the following VARPA examples would return:
=VARPA(C2, C3, C4, C5)
Result: 2.71335

=VARPA(D2, D3, D4)
Result: 81.69468889

=VARPA(34.5, 2, 8.9, -4, FALSE)
Result: 189.3336
Advertisements