

MS Excel 2010: How to Create a Bar Chart
This Excel tutorial explains how to create a basic bar chart in Excel 2010 (with screenshots and step-by-step instructions).
What is a Bar Chart?
A bar chart is a graph that shows horizontal bars with the axis values for the bars displayed on the bottom of the graph.
It is a graphical object used to represent the data in your Excel spreadsheet.
You can use a bar chart when:
- You want to compare values across categories.
- The category text is long and difficult to display in a column chart.
- You want to show duration in a graph.
If you want to follow along with this tutorial, download the example spreadsheet.
Steps to Create a Bar Chart
To create a bar chart in Excel 2010, you will need to do the following steps:
-
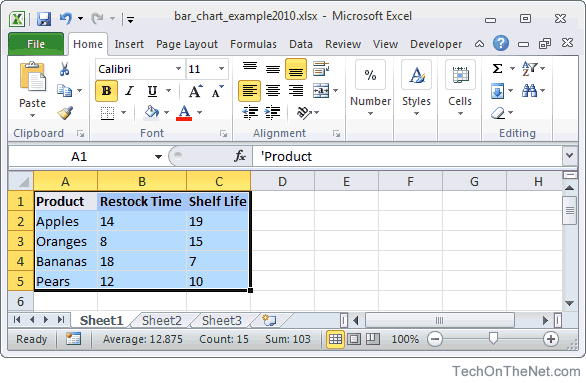
Highlight the data that you would like to use for the bar chart. In this example, we have selected the range A1:C5.
-
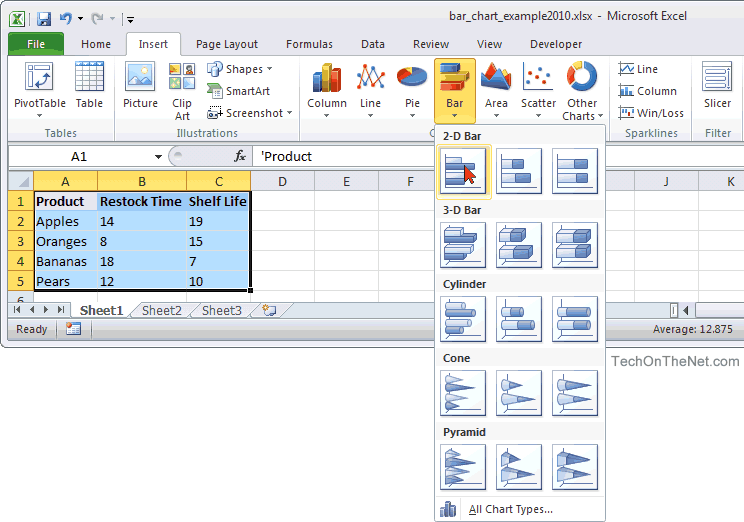
Select the Insert tab in the toolbar at the top of the screen. Click on the Bar button in the Charts group and then select a chart from the drop down menu. In this example, we have selected the first bar chart (called Clustered Bar) in the 2-D Column section.
-
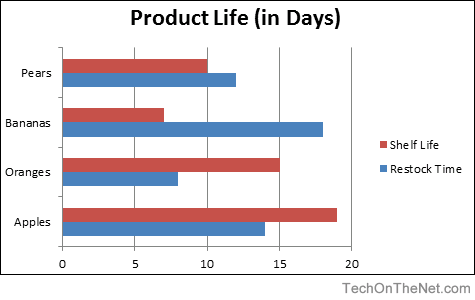
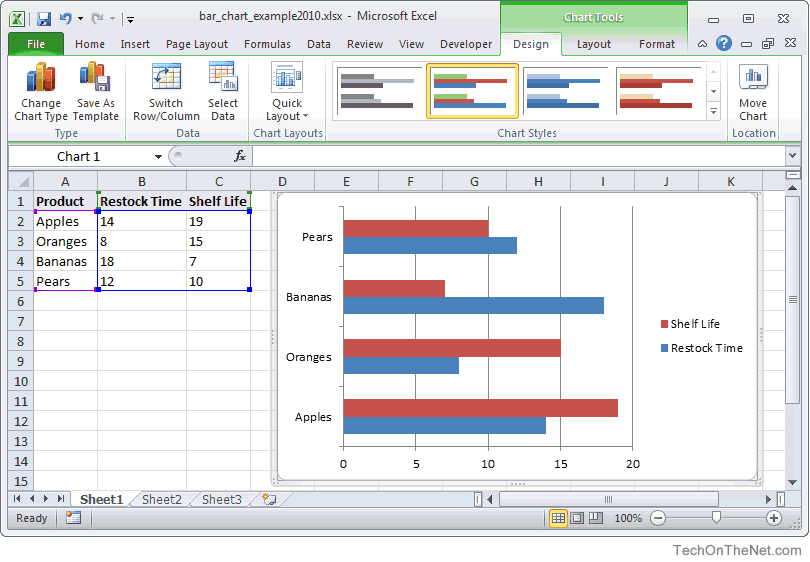
Now you will see the bar chart appear in your spreadsheet with horizontal bars to represent both the shelf life and restock time for each product. The shelf life (in days) is displayed as red horizontal bars and the restock time (in days) is displayed as blue horizontal bars. You can see the axis values on the bottom of the graph for these horizontal bars.
-
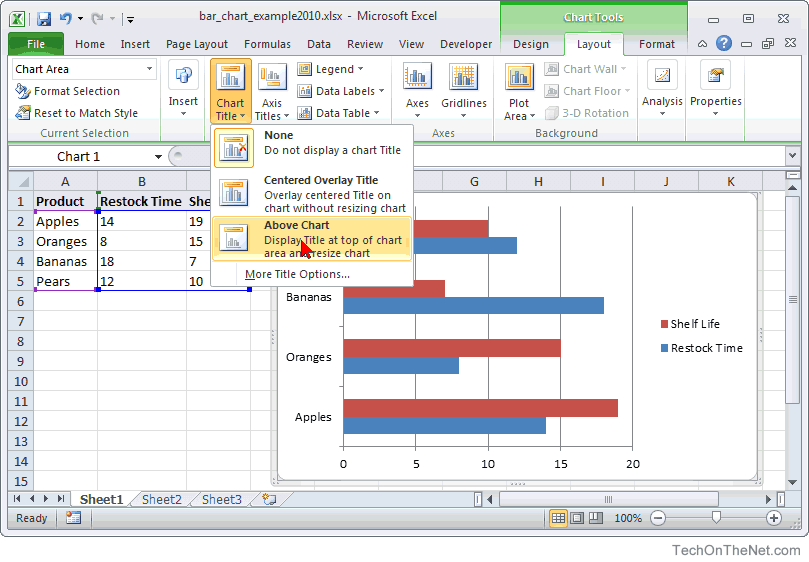
Finally, let's add a title for the bar chart. By default, your chart will be created without a title in Excel 2010.
To add a title, select the Layout tab under Chart Tools in the toolbar at the top of the screen (Chart Tools will only appear when you have the chart selected). Click on the Chart Title button in the Labels group and then select "Above Chart" from the drop down menu.
Now you should see a title appear at the top of the chart area. Click on the title and it will become editable. Enter the text that you would like to see as the title. In this tutorial, we have entered "Product Life (in Days)" as the title for the bar chart.
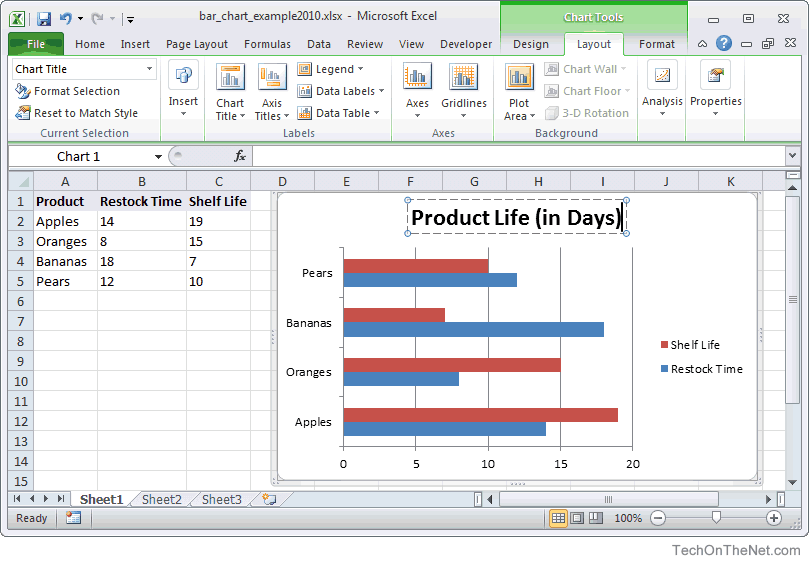
Congratulations, you have finished creating your first bar chart in Excel 2010!
Advertisements