

JavaScript: How to Open the JavaScript Console Log
This JavaScript tutorial explains how to open the web browser console log.
Description
The Console is one of the many Developer Tools available in web browsers. You can use the Console to debug or troubleshoot your JavaScript code. The location where you can find the Console will differ from browser to browser. In this tutorial, we will show you where and how to find the Console in the Google Chrome browser.
Steps to Open the Console Log in Google Chrome
Let's take a look at how to open the console log for the Chrome browser.
-
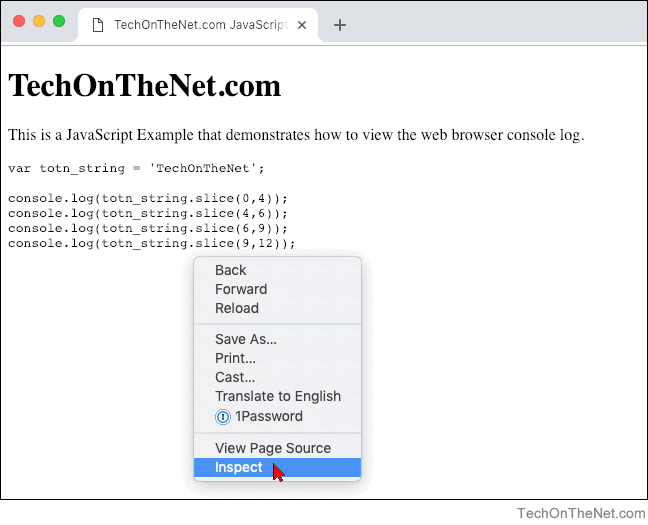
With the Chrome browser open, right-click anywhere in the browser window and select Inspect from the pop-up menu.
-
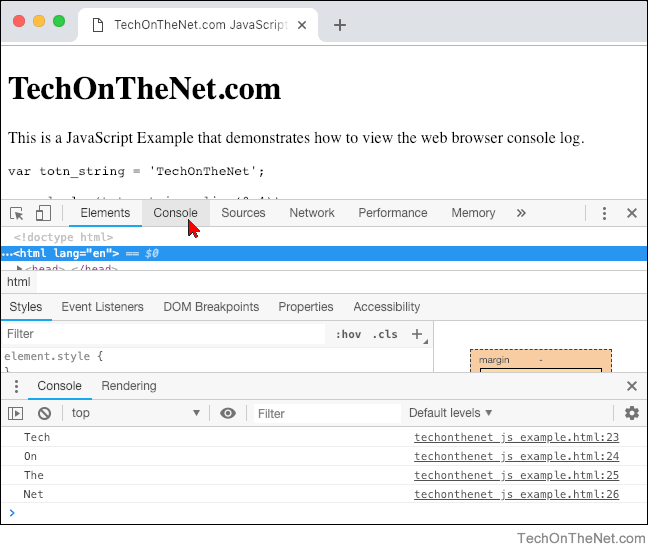
By default, the Inspect will open the "Elements" tab in the Developer Tools. Click on the "Console" tab which is to the right of "Elements".
-
Now you can see the Console and any output that has been written to the Console log.
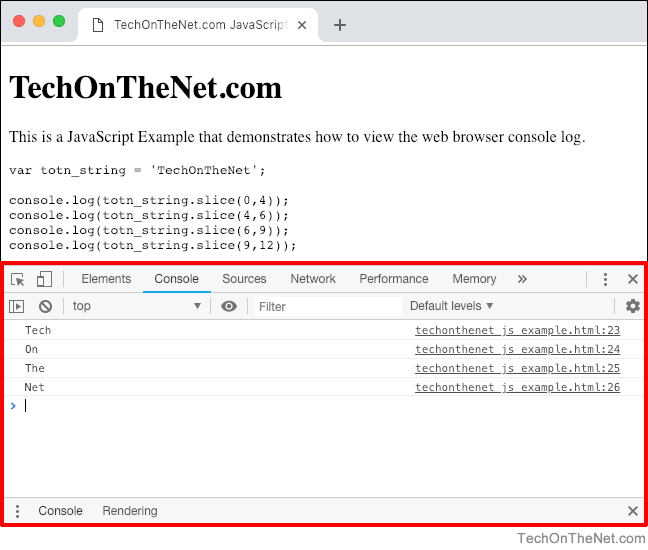
As you can see, we have written the output from the JavaScript slice() method four times to the console log, which output the values 'Tech', 'On', 'The', and 'Net'.
Shortcut Keys for Developer Tools in Google Chrome
There are also several shortcut keys that you can use to open the Chrome Developer Tools. Here are some of the shortcuts that you can use, depending on your version of Chrome:
Windows and Linux:
| Ctrl + Shift + I | Opens the Developer Tools |
| Ctrl + Shift + J | Opens the Developer Tools with the Console tab selected |
| Ctrl + Shift + C | Toggles to Inspect Element mode |
Mac:
| ⌥ + ⌘ + I | Opens the Developer Tools |
| ⌥ + ⌘ + J | Opens the Developer Tools with the Console tab selected |
| ⌥ + ⌘ + C | Toggles the Inspect Element mode |


Advertisements