

MS Excel: How to use the SLOPE Function (WS)
This Excel tutorial explains how to use the Excel SLOPE function with syntax and examples.
Description
The Microsoft Excel SLOPE function returns the slope of a regression line based on the data points identified by known_y_values and known_x_values.
The SLOPE function is a built-in function in Excel that is categorized as a Statistical Function. It can be used as a worksheet function (WS) in Excel. As a worksheet function, the SLOPE function can be entered as part of a formula in a cell of a worksheet.
Syntax
The syntax for the SLOPE function in Microsoft Excel is:
SLOPE( known_y_values, known_x_values )
Parameters or Arguments
- known_y_values
- The known y-values in data points used to calculate the slope.
- known_x_values
- The known x-values in data points used to calculate the slope.
Returns
The SLOPE function returns a numeric value.
If the known_y_values and known_x_values parameters contain different numbers of elements, the SLOPE function will return the #N/A error.
Applies To
- Excel for Office 365, Excel 2019, Excel 2016, Excel 2013, Excel 2011 for Mac, Excel 2010, Excel 2007, Excel 2003
Type of Function
- Worksheet function (WS)
Example (as Worksheet Function)
Let's look at some Excel SLOPE function examples and explore how to use the SLOPE function as a worksheet function in Microsoft Excel:
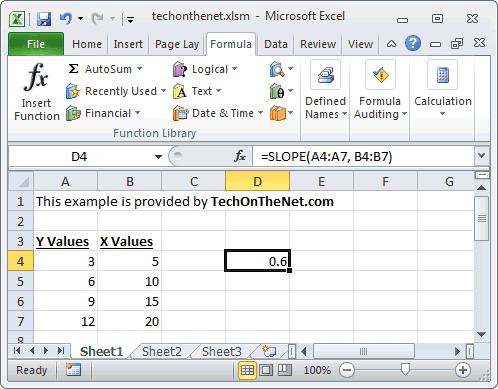
Based on the Excel spreadsheet above, the following SLOPE examples would return:
=SLOPE(A4:A7, B4:B7)
Result: 0.6

=SLOPE({1,2,3,4}, {10,11,12,13})
Result: 1

=SLOPE({2,4,6}, {10,20,30})
Result: 0.2
Advertisements