

MS Excel 2003: Create a column/line chart with 8 columns and 1 line
This Excel tutorial explains how to create column/line chart with 8 columns and 1 line in Excel 2003 and older versions (with screenshots and step-by-step instructions).
Question: I have a question with Excel charts in Microsoft Excel 2003/XP/2000/97.
How can I make a column/line chart. I have 8 rows that I would like graphed in columns and 1 row that I would like on the same graph but in the form of a line. I have tried using the chart wizard, custom chart type called "Line - Column". This format, however, only allows 5 rows of data to appear in the form of columns. Then the rest of the data will default in to the form of lines. Is there a way to prevent this from happening?
Answer: The chart wizard in Excel is a good way to create the starting point for your chart. However, you sometimes need to perform some formatting after your chart is created.
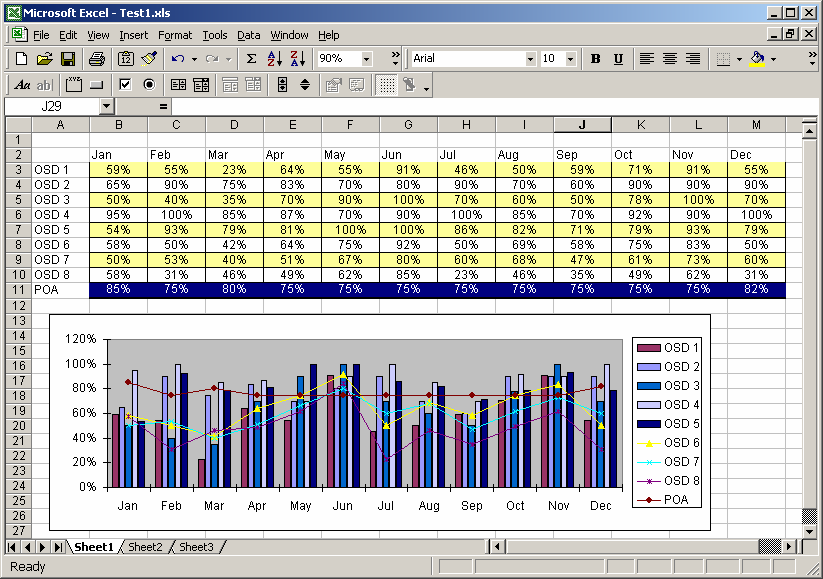
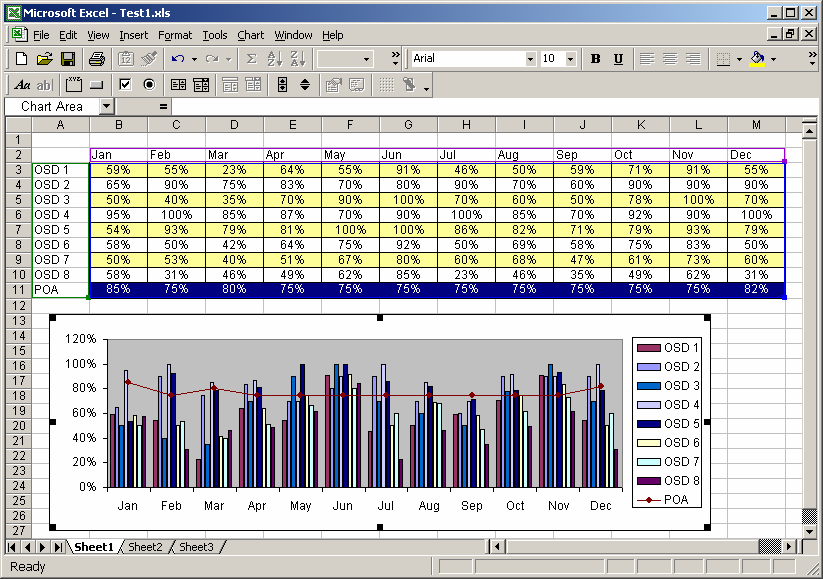
In this example, we want OSD1 through OSD 8 to appear as columns and POA to appear as a line.
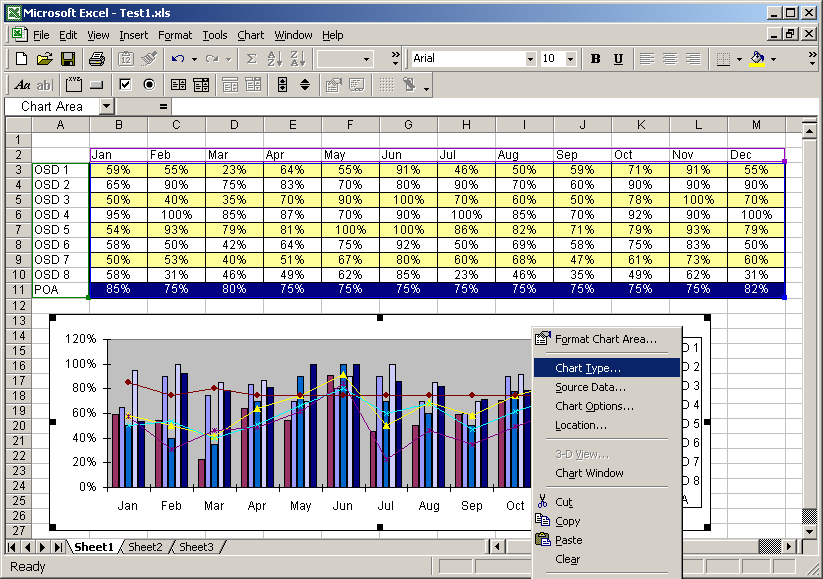
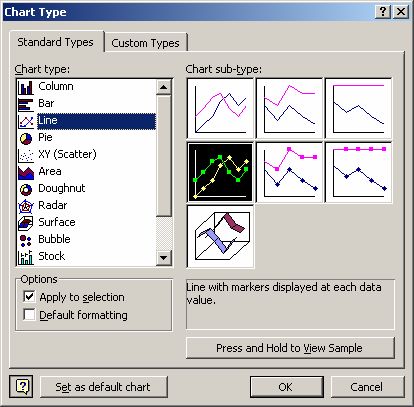
To do this, highlight the full chart and right-click. Select Chart Type from the popup menu.
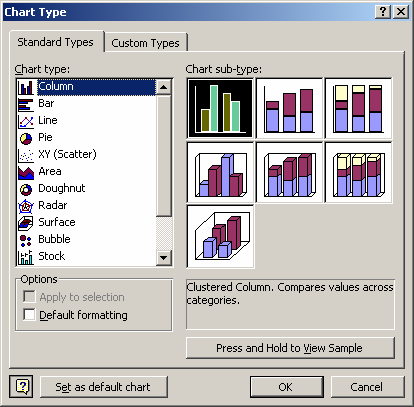
When the Chart Type window appears, select Column as the Chart type and click on the OK button.
Now, in the chart, select the POA data series. A selection box should appear on all POA column objects. Right-click and select Chart Type from the popup menu.
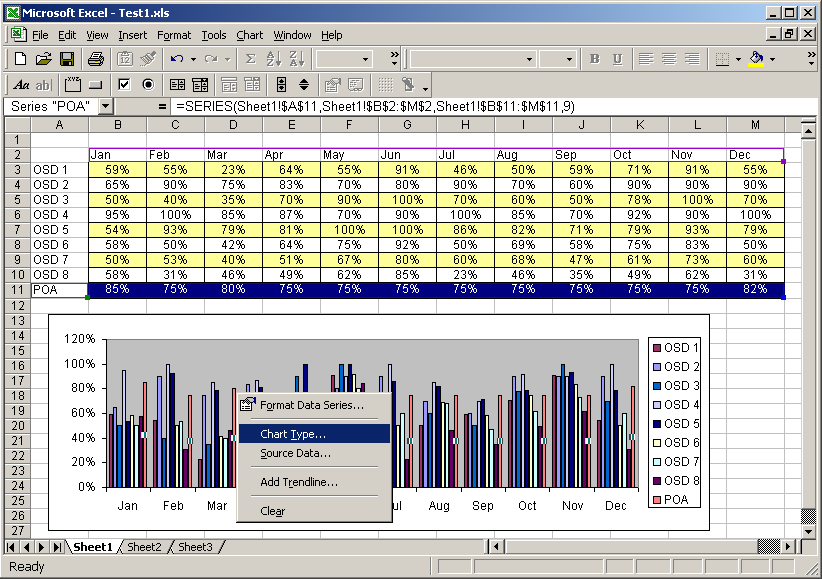
When the Chart Type window appears, select Line and click on the OK button.
Now when you view the chart, OSD 1 through OSD 8 should appear as columns and POA should appear as a line.
Advertisements