

MS Access 2003: Create a graph (ie: chart report)
This MSAccess tutorial explains how to create graph or chart report in Access 2003 (with screenshots and step-by-step instructions).
Question: In Microsoft Access 2003/XP/2000/97, is it possible to create a graph?
Answer: Yes, in Access you can create a graph. This is called a Chart report.
Let's walk through an example.
Open your Access database and click on the Reports tab in the Database window.
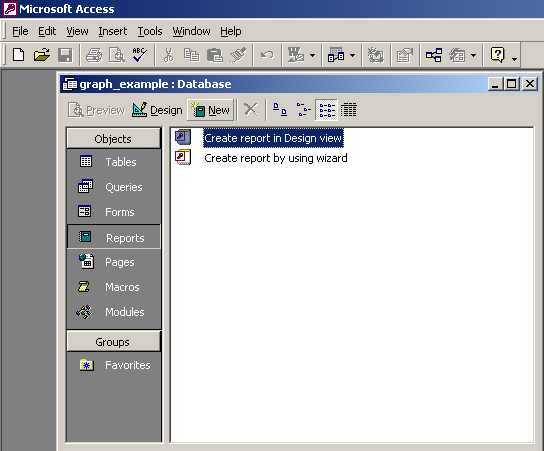
Click on the New button.
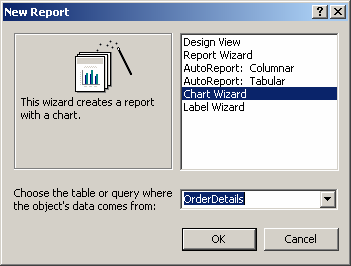
When the New Report window appears, highlight Chart Wizard. Then select the query/table that you wish to use to create the graph. In this example, we've chosen the OrderDetails. Click on the OK button.
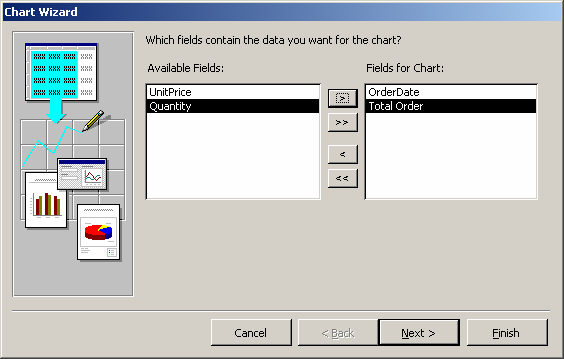
Select the fields that you want to use in the graph. We've selected the OrderDate and Total Order fields. Click on the Next button.
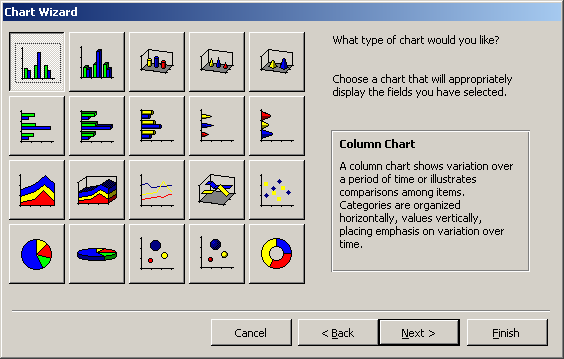
Select the type of graph that you'd like displayed. Click on the Next button.
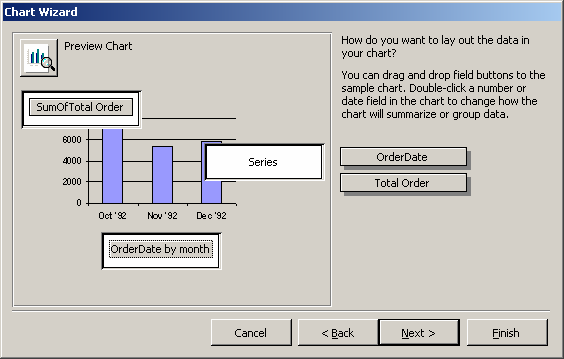
Customize the layout of the graph. In this example, the Chart Wizard has chosen "OrderDate by month" for the x-axis of the graph. We want to see the date by year. To change this, double-click on the "OrderDate by month" button.
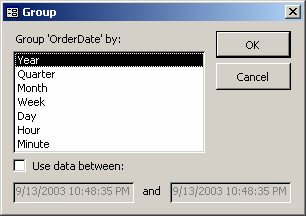
When the Group window appears, we've highlighted the Year value since we wish to see the graph summarized by year (not month). Next, click on the OK button.
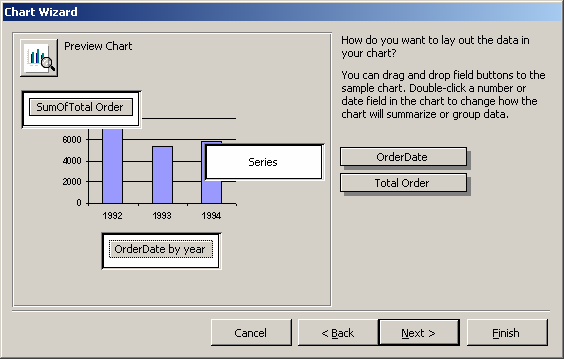
Now when we return to the Chart Wizard, the x-axis label displays "OrderDate by year". Click on the Next button.
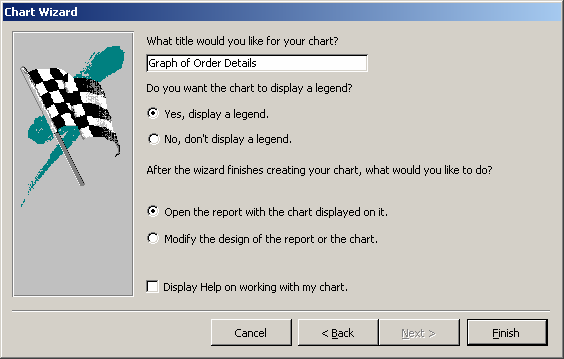
Next, select a title for the graph. Click on the Finish button.
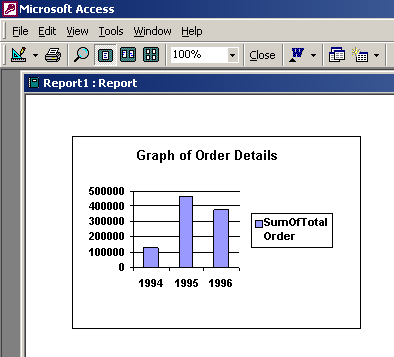
Now when we view the report, we should see the graph that we've just created.
Advertisements